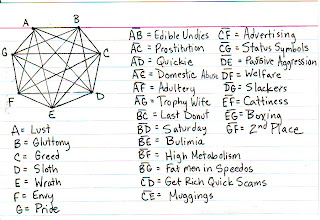
If you plot the 7 deadly sins as 7 nodes in a graph, and then convert it to a fully connected graph, each edge in the graph will represent a secondary deadly sin consisting of a pair of the original deadly sins. Then you get this fascinating diagram from:
